Freeing Awair Sensor Data
After reading a couple alarmist blog posts about indoor air quality last year I bought a smart sensor from Awair. I was worried high carbon dioxide concentration in my bedroom was damaging my sleep quality. The only way I was able to stop thinking about it was by actually measuring the quality of the air I breathe.
The sensor measures 4 things: temperature, humidity, carbon dioxide (CO2), and volatile organic compounds (VOCs). It works well and has a functioning Android app with pretty charts. Since I bought it I have been more conscious of the air quality in my living space, especially where I am sleeping.
Unfortunately, as of March 2020 there is no way to export historical data without emailing customer support. I would like to have a copy of the data my sensor has recorded without emailing anyone. It’s my data after all!

The lack of an easy data export isn’t the end of the road. Awair exposes sensor data via a developer API. In the rest of this post, I’ll share how I setup a nightly job on AWS to backup data from my Awair sensor.
Awair Developer API
Awair’s API allows you to request data and change the mode of their devices programatically. The API is split up into four sections:
- Users: Returns information about devices and API quotas.
- Organization: Endpoints for Awair’s enterprise offering
- Air Data: Returns time series sensor data
- Device Management: Returns and controls device operating mode
For this project, we are only interested in time series data. The air
data API can return data at four different time intervals: latest,
raw, 5-min-avg, and 15-min-avg. I decided to backup data at the
5-min-avg interval, but if you need more fidelity the raw data
endpoint has a 10 second resolution.
Here’s what a response from the 5-min-avg endpoint looks
like:
$ curl --location --request GET \
"https://developer-apis.awair.is/v1/users/self/devices/${device_type}/${device_id}/air-data/5-min-avg" \
--header "Authorization: Bearer ${token}" -o awair-response.json
$ cat awair-response.json | jq .
{
  "data": [
    {
      "timestamp": "2020-02-22T10:00:00.000Z",
      "score": 74,
      "sensors": [
        {
          "comp": "temp",
          "value": 21.770000457763672
        }, {
          "comp": "humid",
          "value": 28.445000648498535
        }, {
          "comp": "co2",
          "value": 1196.5
        }, {
          "comp": "voc",
          "value": 1172
        }
      ],
      "indices": [
        {
          "comp": "temp",
          "value": -1
        }, {
          "comp": "humid",
          "value": -2
        }, {
          "comp": "co2",
          "value": 1
        }, {
          "comp": "voc",
          "value": 2
        }
      ]
    }
      ...
}
The API returns sensor measurement data and “indices” at regular timesteps (e.g. 12:00, 12:05, 12:10) plus an overall air quality score for the period.
What Awair calls “indices” in the response are normalized air quality scores. These scores map the sensor measurements to a 10 point scale from -5 to 5, with 0 being ideal. The scores are based on Awair’s estimates of optimal air quality ranges:
From medical and academic research, we have estimated a range of optimal values for these key environmental factors: temperature (22 C - 26 C, or 71.6 F - 78.8 F), humidity (40% - 50%), CO2 (<600ppm) and chemicals (<333ppb) and fine dust (<15 μg/m3).
Awair then aggregates the scores for each measurement to provide the overall air quality score at each timestep.
Backing up data with a bash script
To backup data returned from the API, we need to make a request periodically and store the response JSON somewhere. Expanding on the curl snippet from above, we can write a bash script to request data from the Awair API and save it someplace on disk:
#!/bin/bash

device_type="your-device-type"
device_id="your-device-id"
token="your-api-token"

timestamp=$(date +%s)
backup_loc="~/data/awair/${timestamp}.json"

url="https://developer-apis.awair.is/v1/users/self/devices/${device_type}/${device_id}/air-data/5-min-avg"
curl --location --request GET $url \
  --header "Authorization: Bearer ${token}" -o $backup_loc
Save this script somewhere, then schedule it with cron. Boom! Project over, time for lunch.
Backing up data with a Lambda function
Just kidding! Instead of the perfectly fine bash solution, let’s complicate things by setting up our ETL in the cloud with a serverless compute function.
Serverless compute functions let you run code in the cloud without managing infrastructure. Not only can you avoid dealing with a physical server, you can also avoid dealing with a VM too! Serverless functions run in stateless containers managed by your hosting provider and are only active when triggered by an event.
In the serverless version of the backup job, the following three AWS services will replace curl, cron, and disk storage from the bash approach earlier. You could use equivalent services from any of the other major cloud hosting providers too.
Nightly at a specified time, we can schedule CloudWatch to generate an event and invoke a Lambda function. The function will execute some Javascript to make a request to the Awair API and save the response to a S3 bucket.
For the gory details, including step-by-step instructions, and a Terraform config file, check out that gist I mentioned earlier in the post.
Results
With the backup running nightly, I can rest peacefully knowing I’ll have a copy of my past sensor recordings even if Awair goes out of business. But instead of ending things here, let’s do some analysis and make a couple charts:
The air quality data saved to S3 is a set of JSON files, one for each day:
# Check what data we have in our bucket
$ aws s3 ls s3://awair-data
2020-02-18 10:00:23     107700 1582020021930.json
2020-02-19 10:00:23     107818 1582106422092.json
2020-02-20 10:00:39     106036 1582192822056.json

# Copy data to a local folder
$ aws s3 cp --recursive s3://awair-data awair_data
download: s3://awair-data/1582020021930.json to awair_data/1582020021930.json
download: s3://awair-data/1582538422158.json to awair_data/1582538422158.json
download: s3://awair-data/1582365621916.json to awair_data/1582365621916.json
For painless ingestion into R, it can help to first convert JSON data to a CSV file. This jq script aggregates the JSON files, extracts the sensor data, and outputs a CSV:
$ jq -rs '
  ["timestamp", .[0].data[0].sensors[].comp],
  (.[].data[]
    | {timestamp} +
      (.sensors
        | map({(.comp): .value})
        | add )
        | map(.))
  | @csv' air_data/*.json > air_data.csv
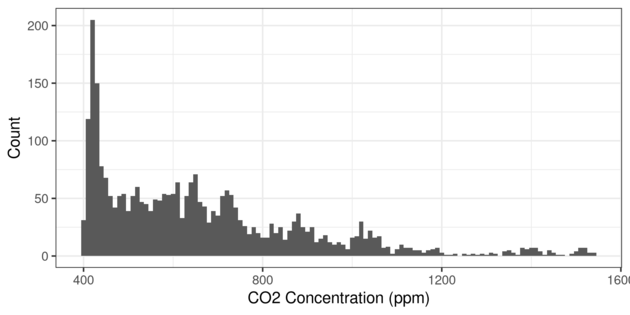
Now let’s plot up the results with ggplot2. Here’s a histogram of CO2 concentration:
library(ggplot2)

dat <- read.csv("./air_data.csv", stringsAsFactors = F)
dat$timestamp <- as.POSIXct(dat$timestamp,
    format = "%Y-%m-%dT%H:%M:%OS", tz = "GMT")
dat <- dat[order(dat$timestamp), ]

hist <- ggplot(dat, aes(x = co2)) +
  geom_histogram(binwidth = 10) +
  labs(x = "CO2 Concentration (ppm)", y = "Count") +
  theme_bw()
And here’s a time series chart of CO2 concentration:
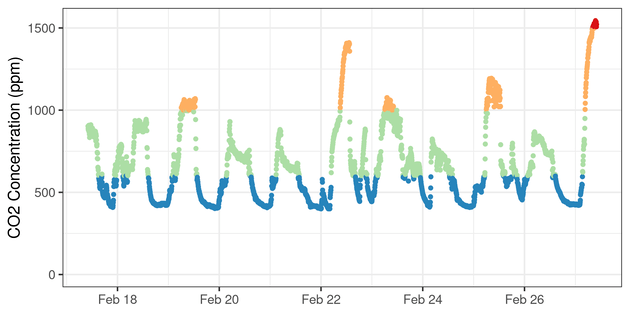
dat$co2_bins <- cut(dat$co2, breaks = c(0, 600, 1000, 1500, 2500))

timeseries <- ggplot(dat, aes(x = timestamp, y = co2)) +
  geom_point(size = 1, show.legend = F,
    aes(color = co2_bins, group = NA)) +
  labs(x = NULL, y = "CO2 Concentration (ppm)", color = NULL) +
  scale_color_brewer(palette = "Spectral", drop = F, direction = -1) +
  expand_limits(y = 0) +
  theme_bw()
Wrap-up
Thanks for reading my small data liberation story. If you have any smart devices at home hopefully this post will inspire you to exfiltrate your own data. Thanks to Awair for making a cool air quality sensor and implementing a developer API. I will update this post with a note when Awair adds a full data export feature.